
Data supplement · Candid blog
Who leads — and who's represented?
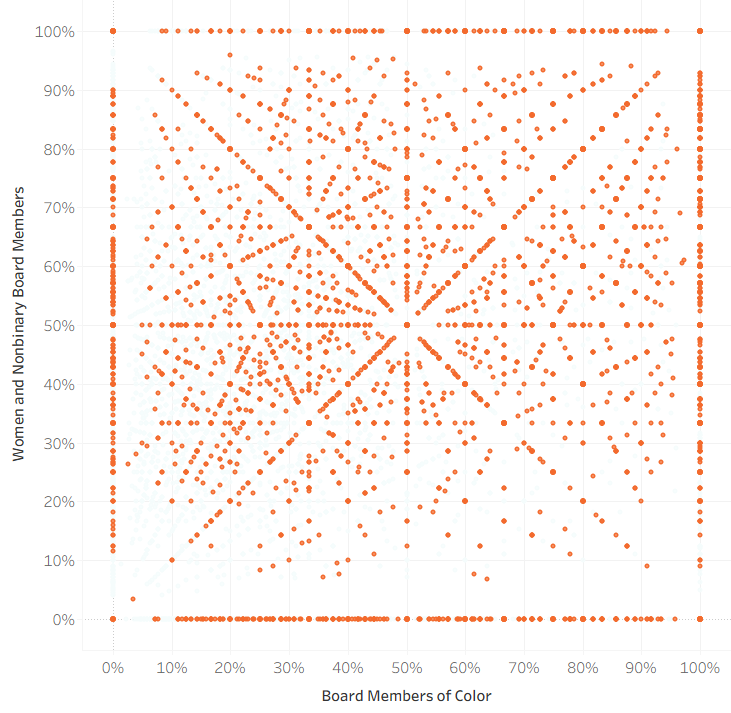
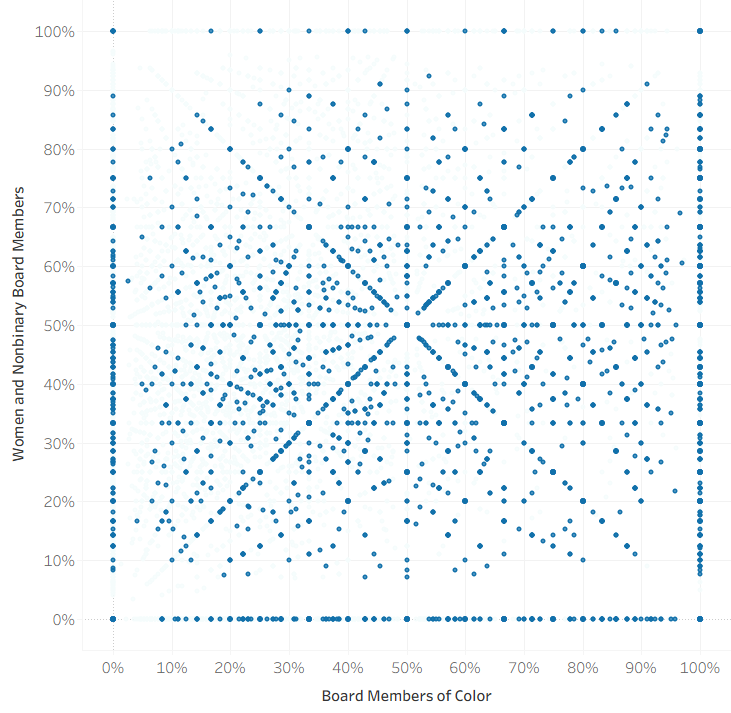
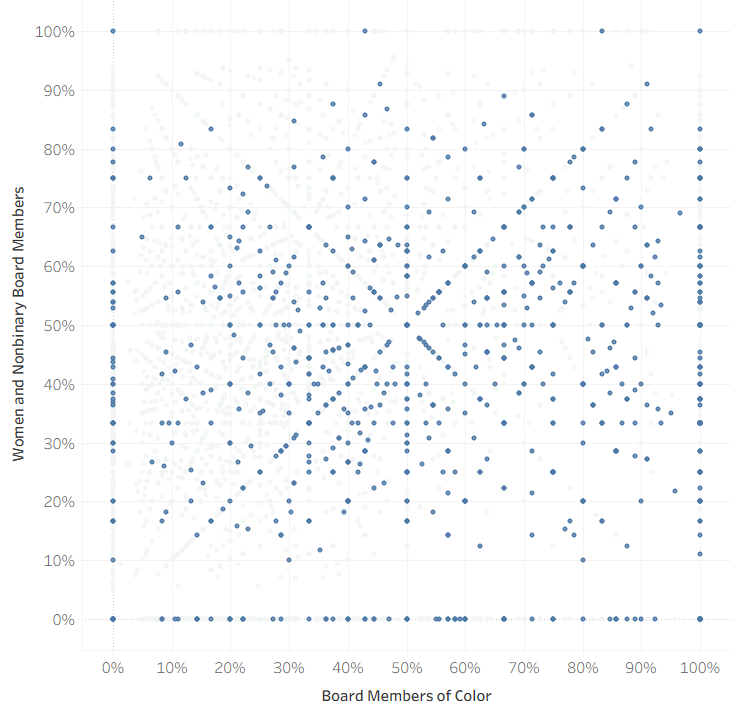
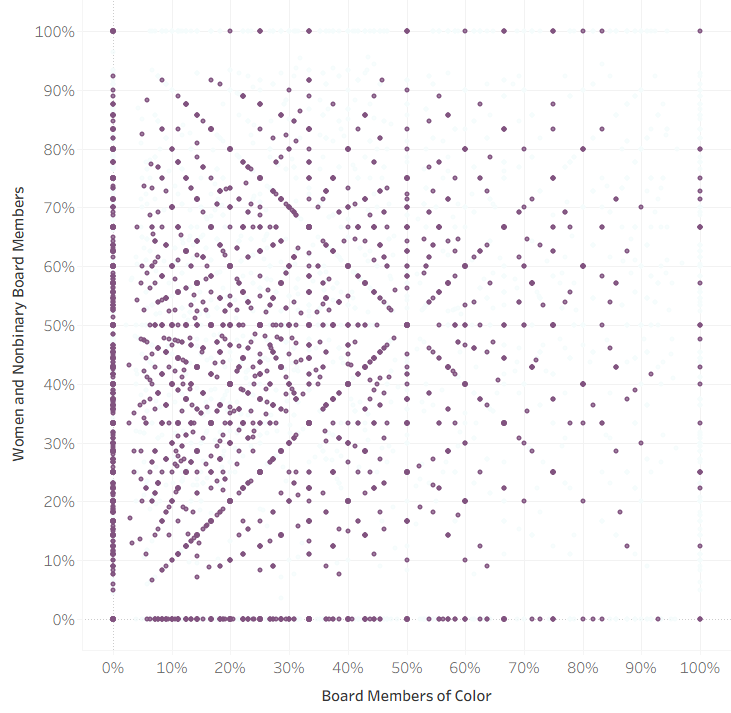
These visualizations surface a consistent structural pattern: organizations with the highest levels of community-aligned leadership operate with the least capital. Together, the charts map how representation across race and gender shows up in boards and staff — and how those dynamics evolve as organizations grow. These patterns are not only about representation — they reflect how power is structured within organizations.
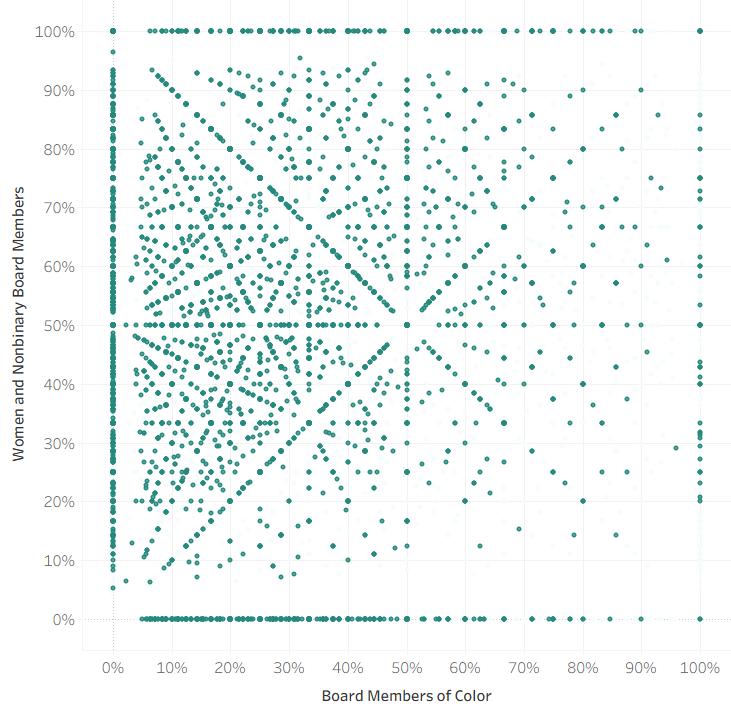
Upper left: >50% women & nonbinary, <50% people of color
Upper right: >50% women & nonbinary, >50% people of color
Lower left: <50% women & nonbinary, <50% people of color
Lower right: <50% women & nonbinary, >50% people of color
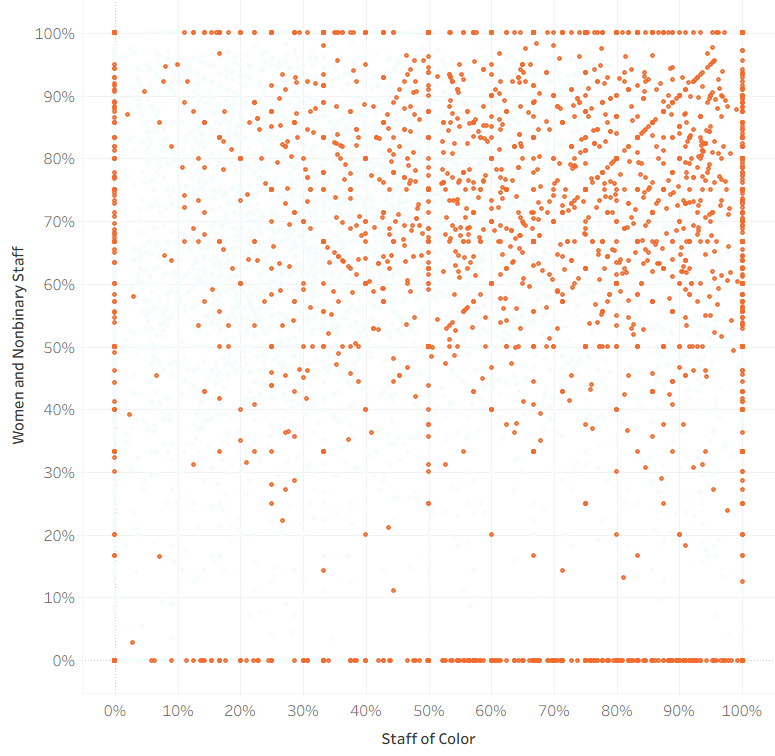
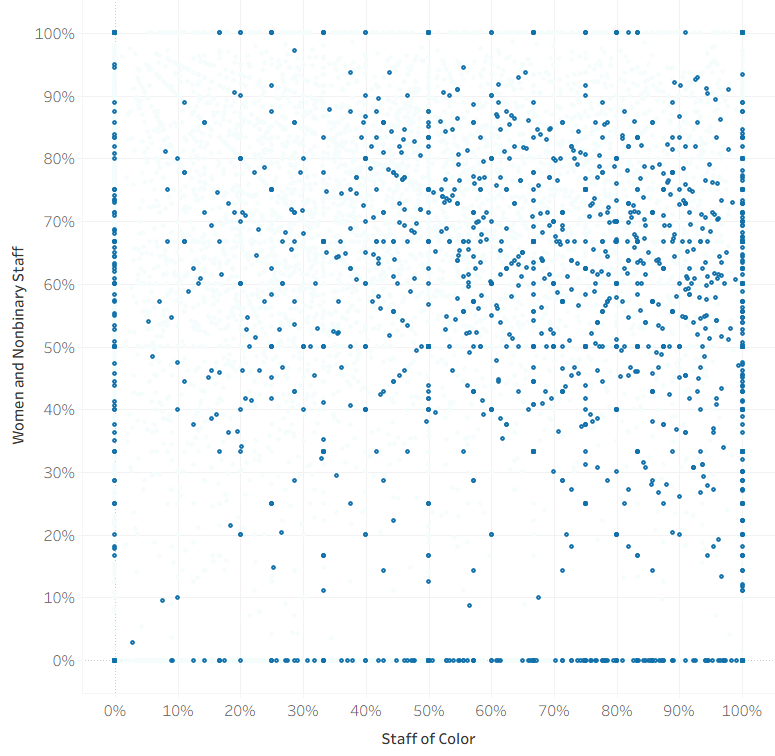
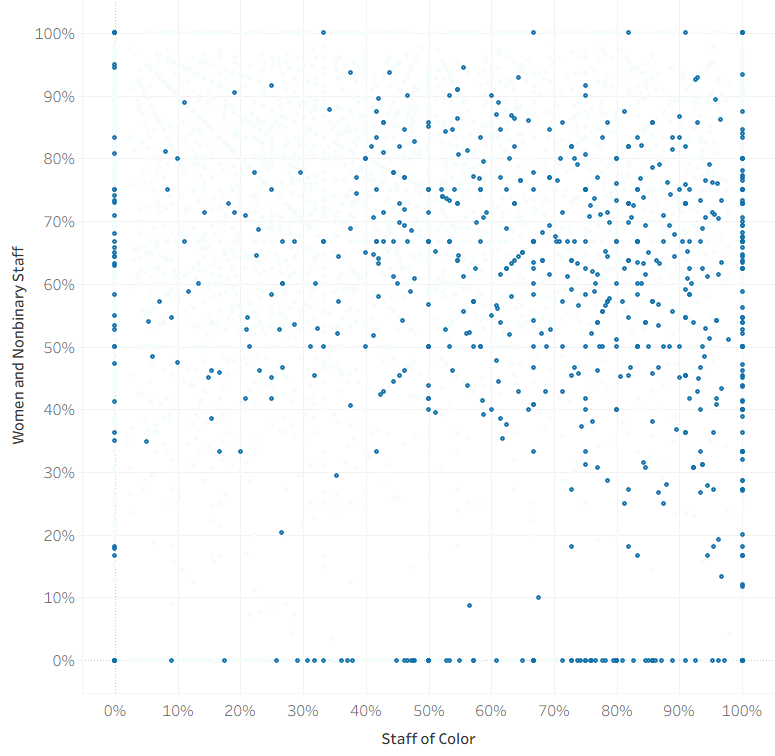
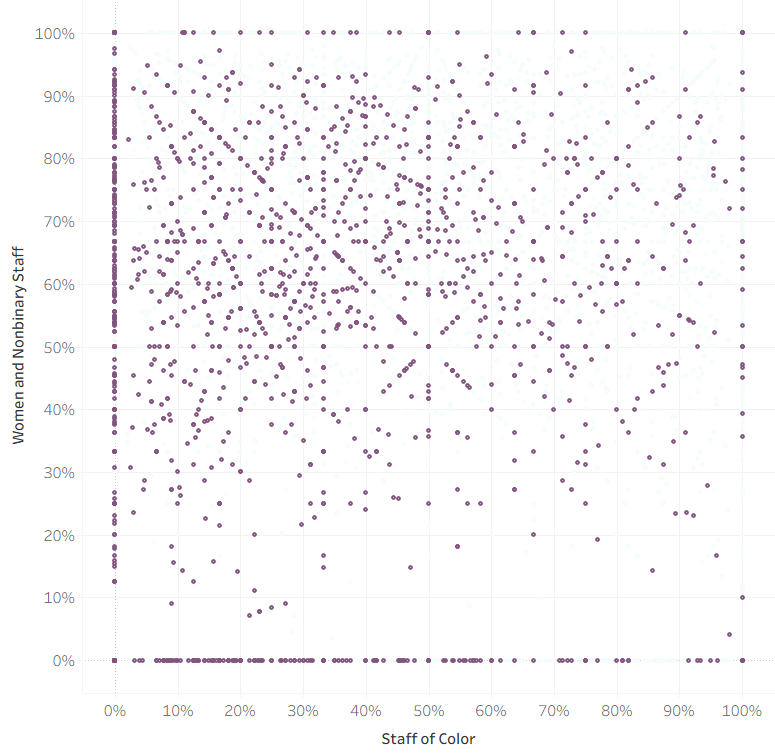
These organizations show the highest representation of women and nonbinary people alongside the highest racial diversity across both boards and staff. Staff cluster in the upper-right, while boards cluster around the center — indicating balanced representation across race and gender. This is the only group where both axes are consistently strong across governance and staff. They achieve this with the least capital and the most precarious funding base.
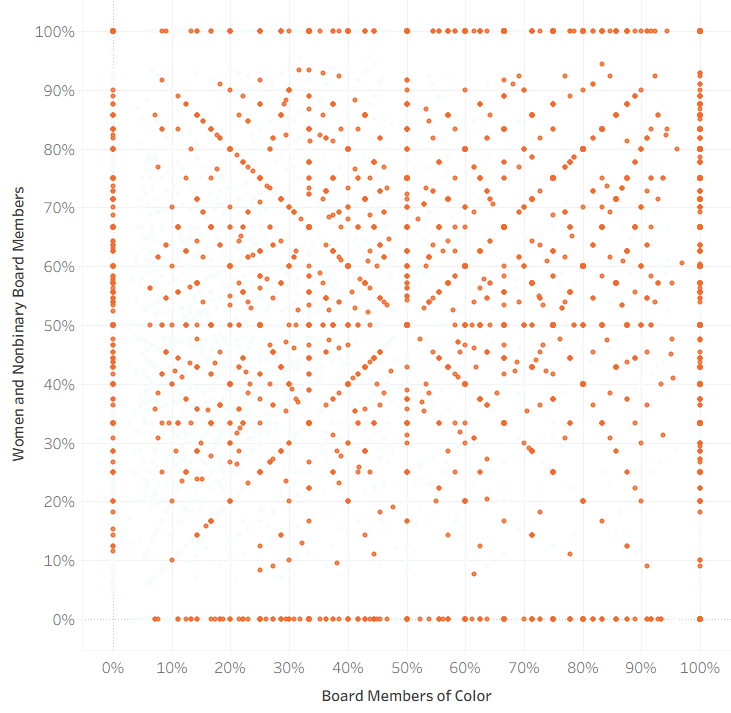
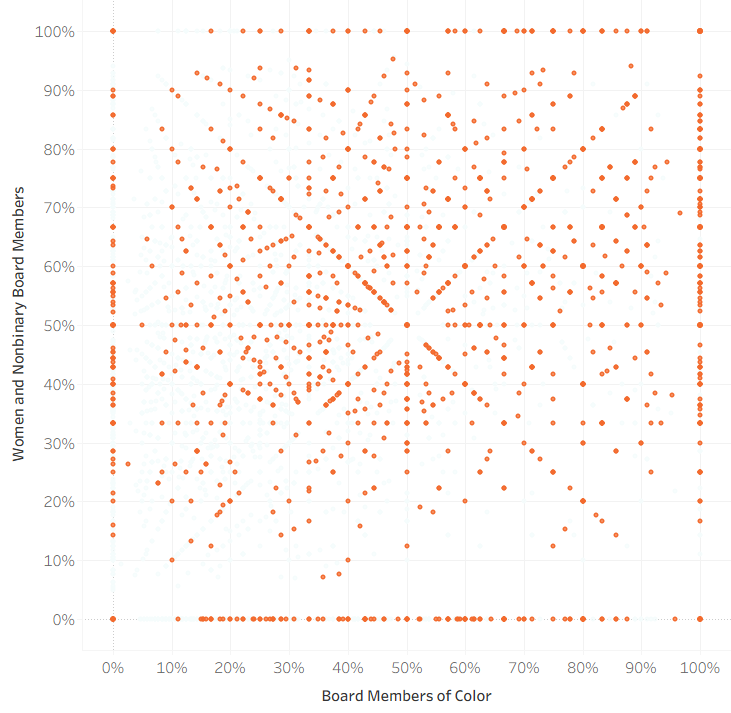
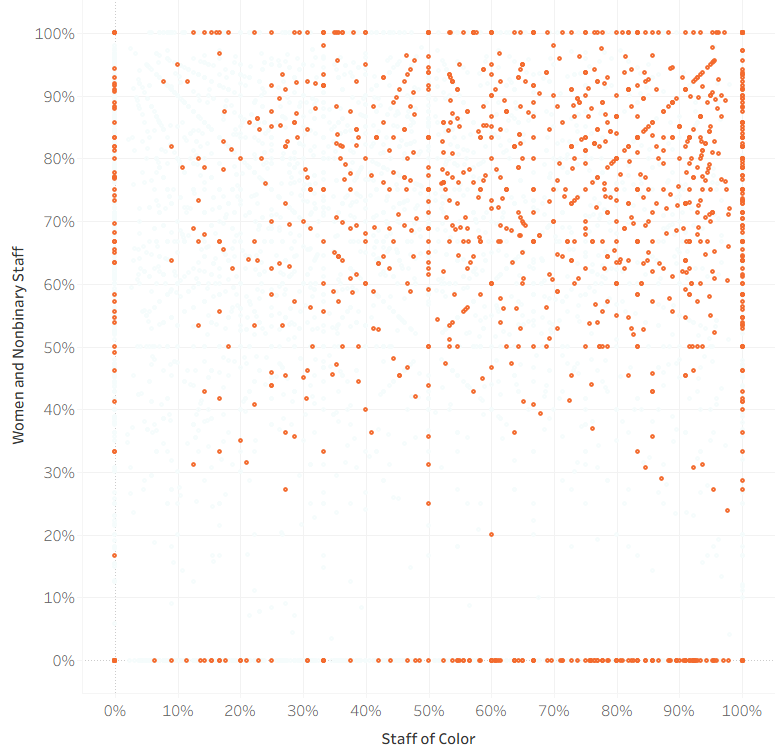
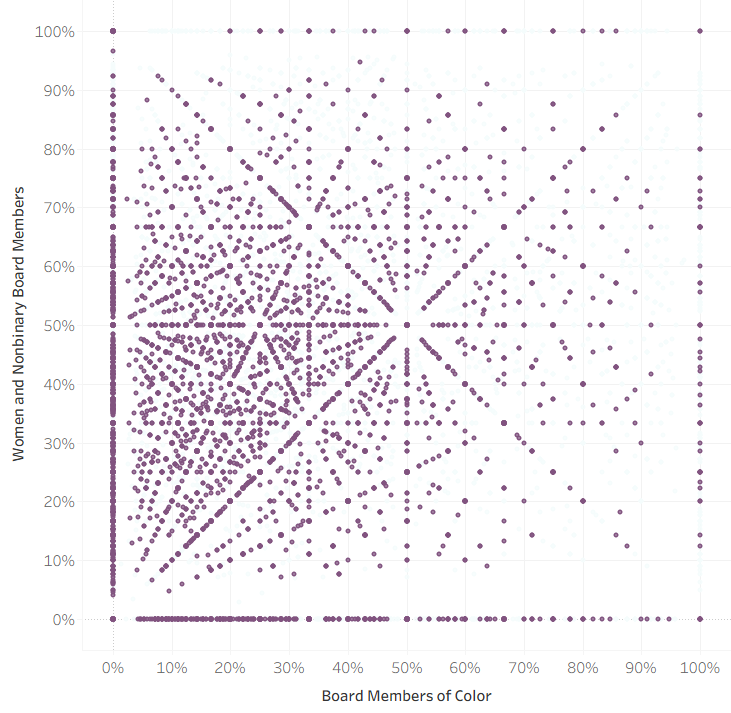
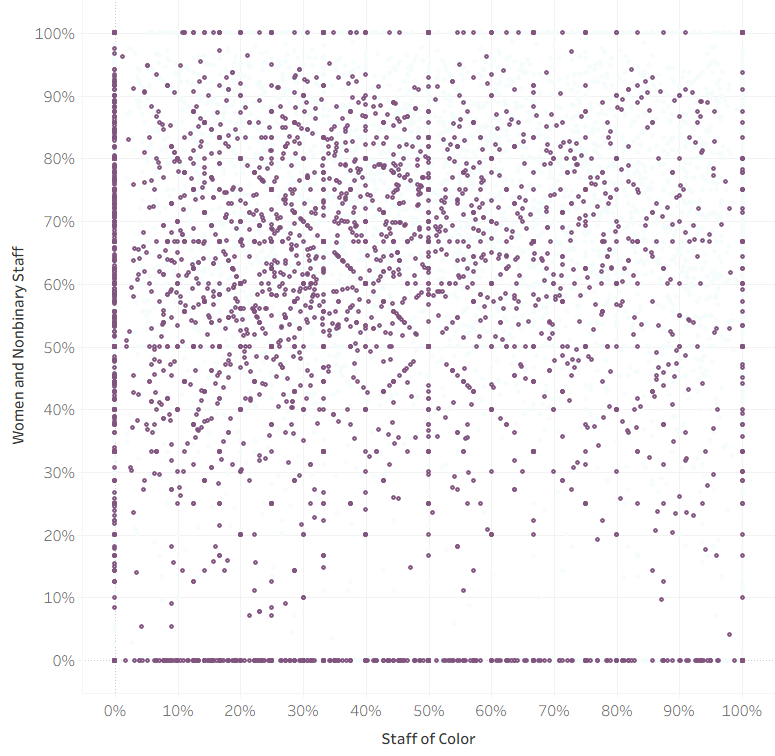
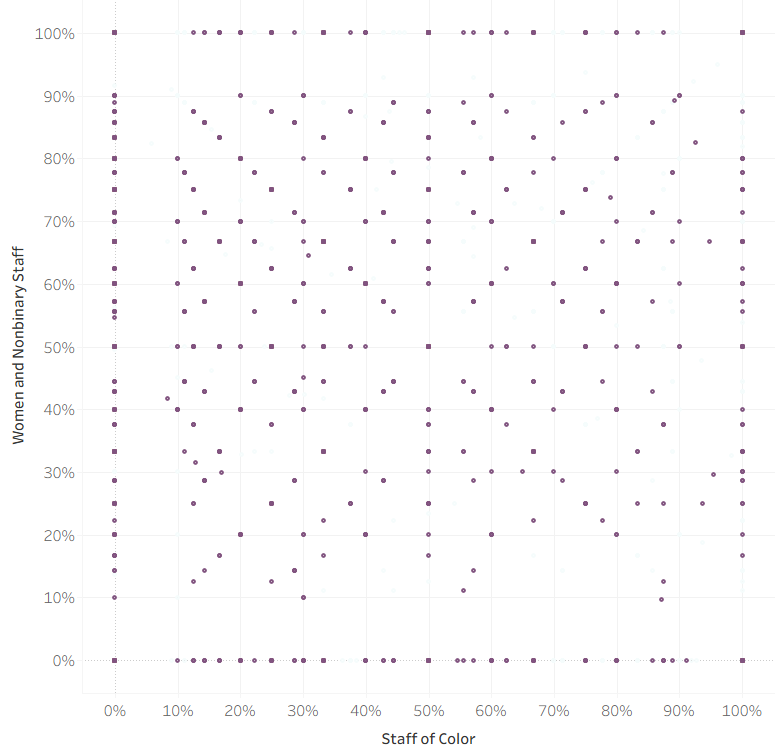
These organizations show high representation of women and nonbinary people across both boards and staff. Racial diversity remains low — and becomes more entrenched at the board level, where organizations cluster in the upper-left of the chart. Staff show more variation, with some organizations moving toward greater racial diversity — but this shift is not reflected in boards.
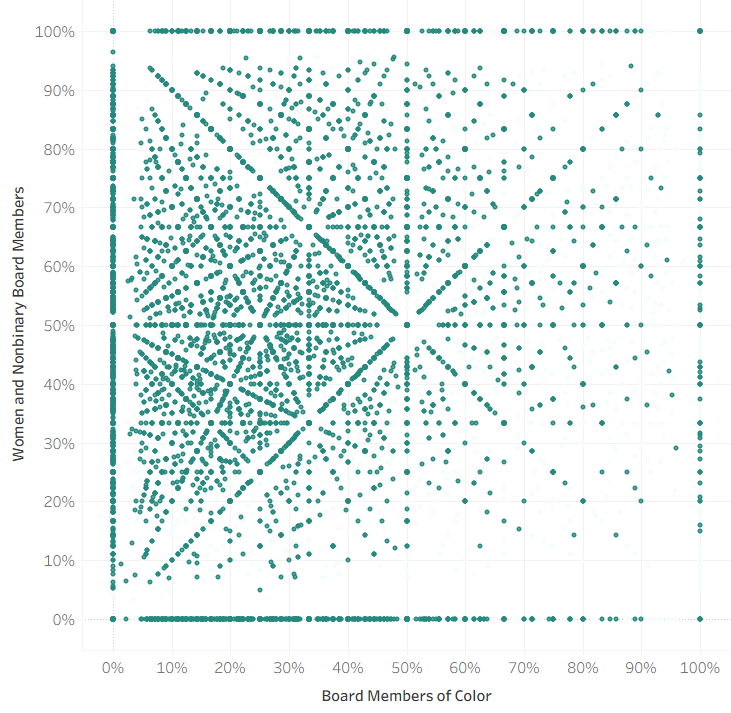
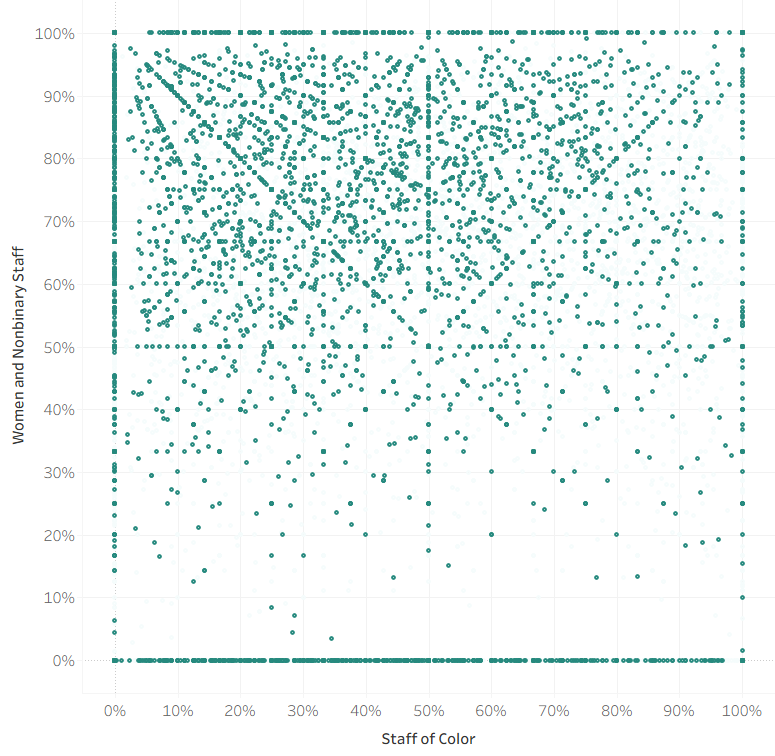
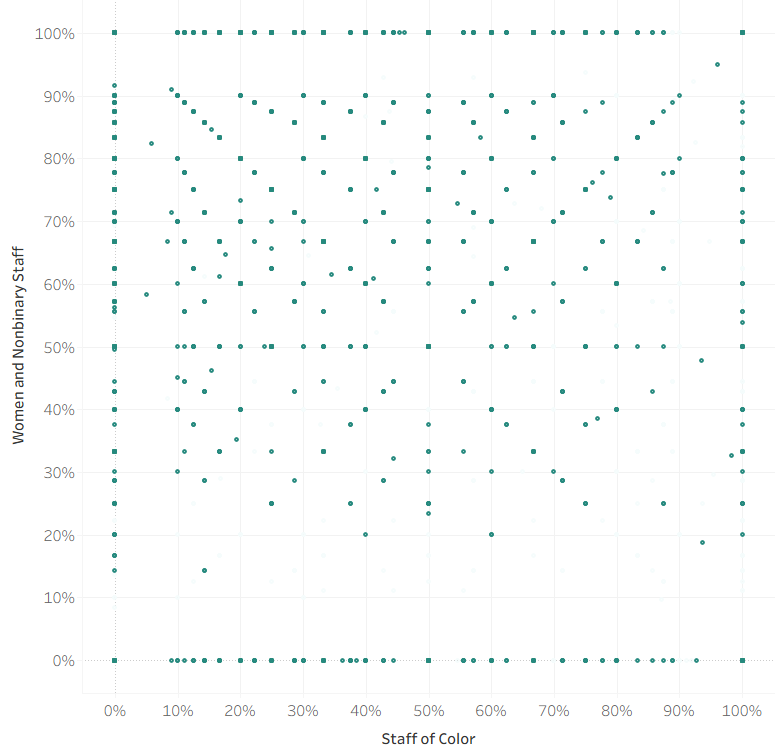
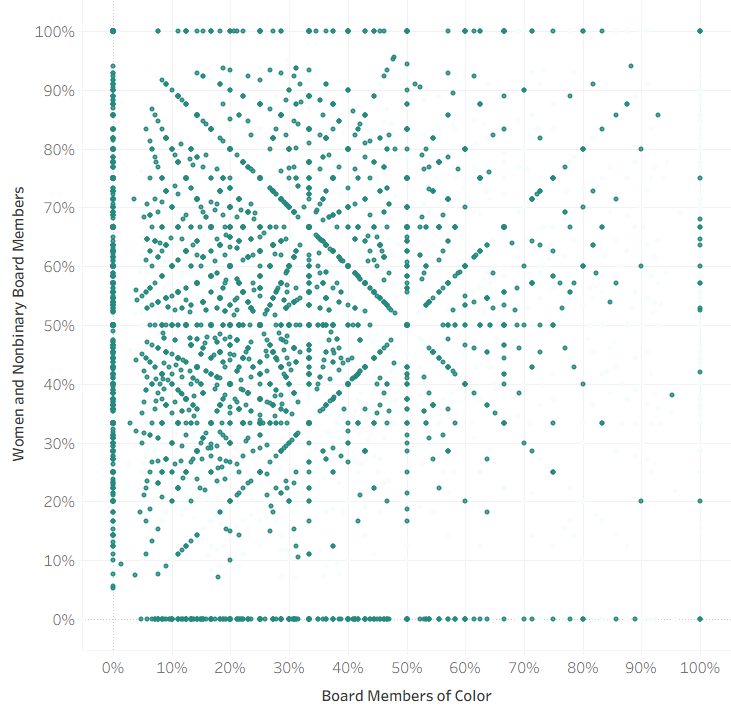
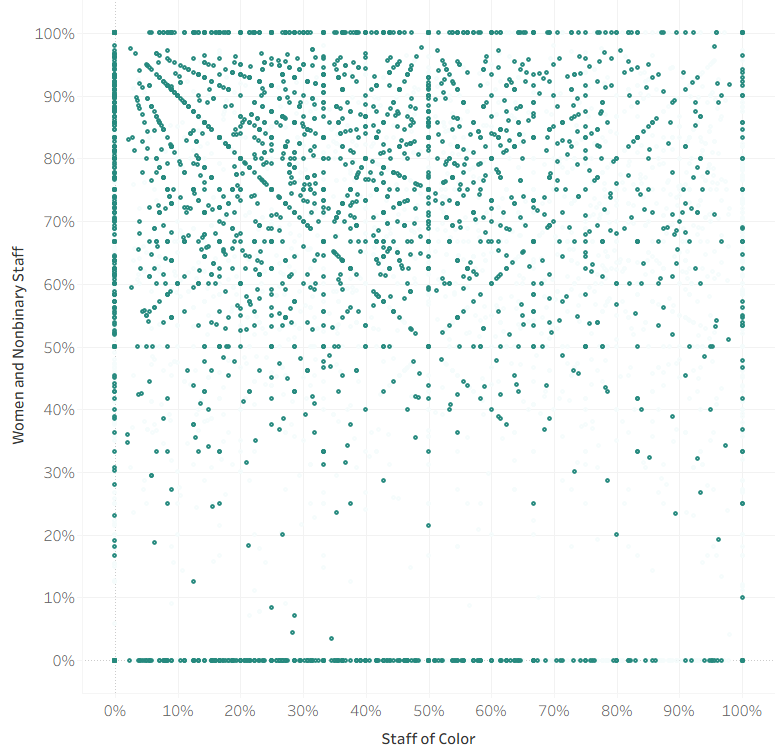
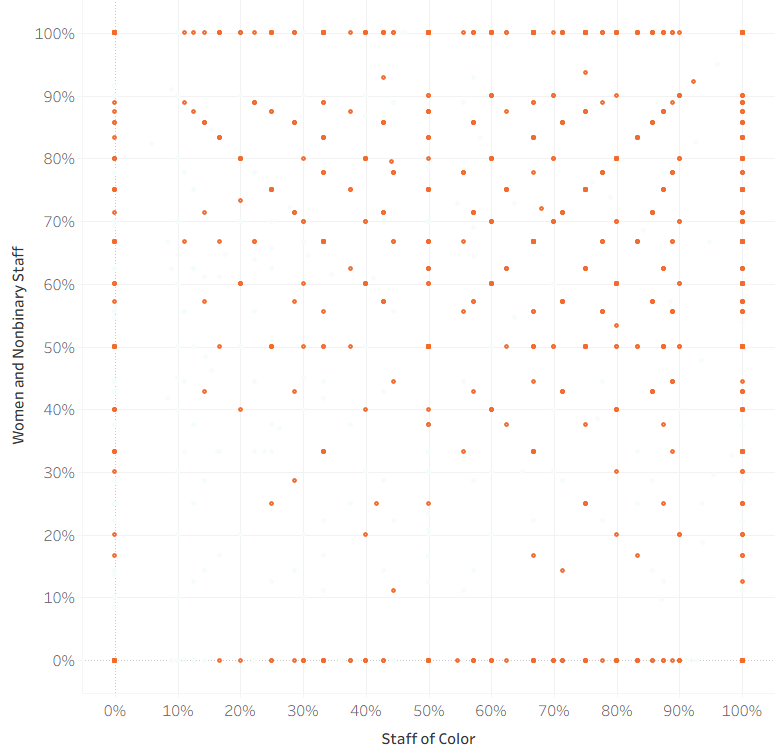
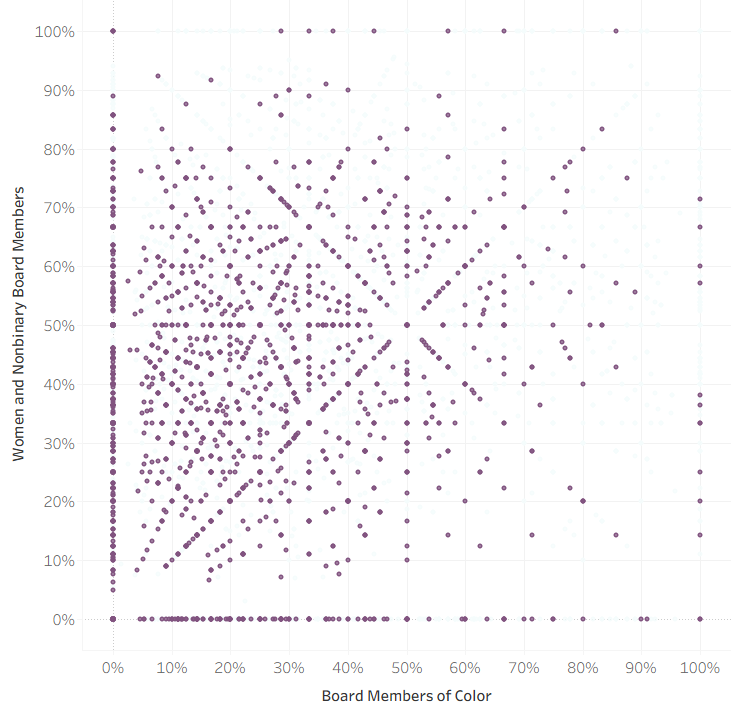
Racial diversity increases across both boards and staff, with organizations shifting rightward in each chart. Staff cluster strongly in the upper-right, showing high representation of women and nonbinary people alongside racial diversity. Boards, however, remain more male-skewed. Intersectional representation is present in staff but not reflected in governance.
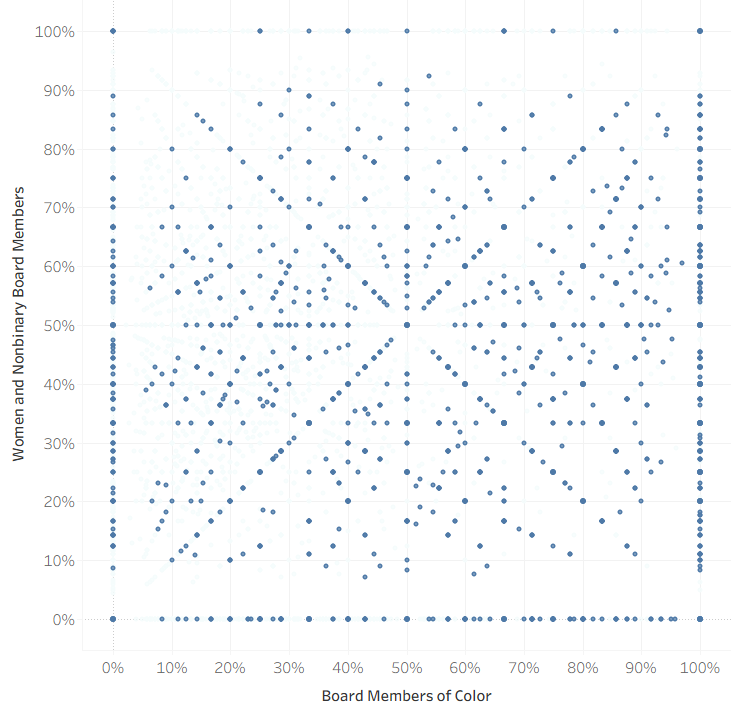
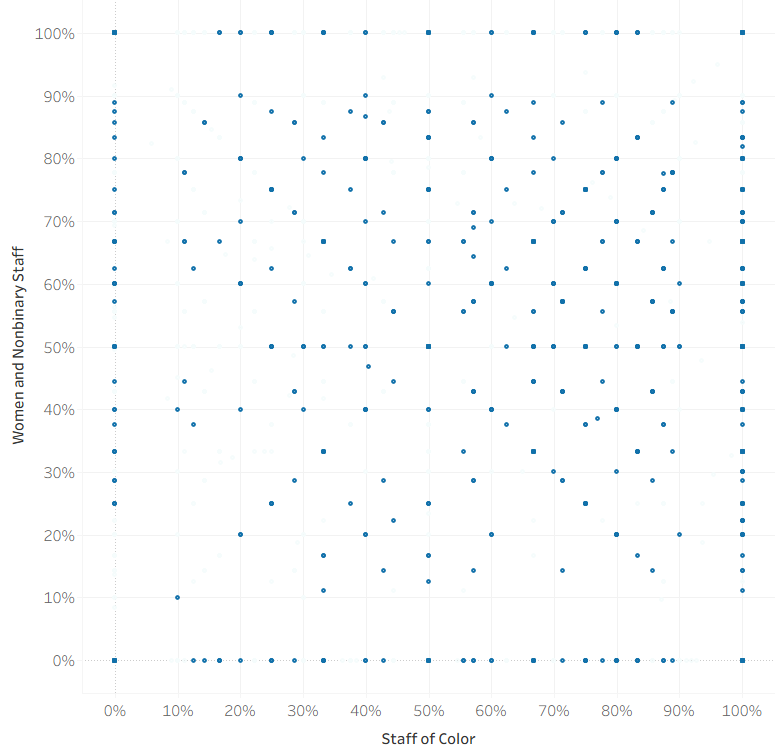
The reference point. Low racial diversity across both boards and staff, with organizations clustering on the left side of each chart. Boards also show low representation of women and nonbinary people. Staff show some gender diversity, including clustering in the upper-left — but this is not reflected in boards and does not extend to racial diversity.
Explore the full DataWoven dataset →
About this data
Data from Candid's Demographics via Candid dataset and 2023-2024 IRS Form 990 filings from more than 77,000 organizations. The scatter plots show the proportion of women and nonbinary people and people of color on boards and staff, by leader identity. Organizations self-report leader identity, board composition, and staff demographics through Demographics via Candid.Full methodology at candid.org and genderpoint.org/datawoven.